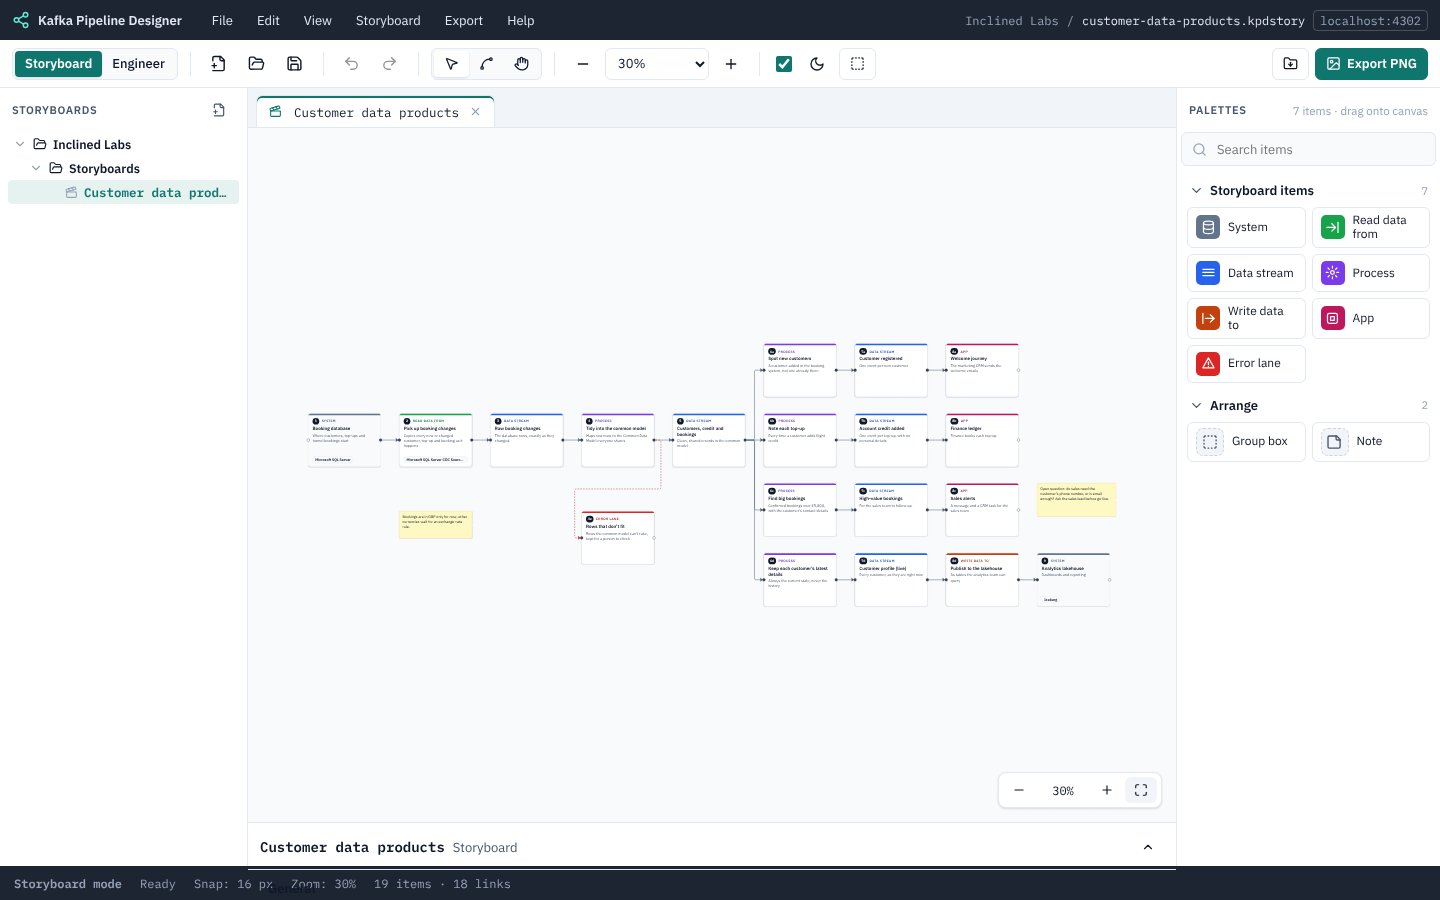
Storyboard mode
Sketch the story of a pipeline in plain words, with systems, data streams and steps, before anyone picks a topic or a connector setting. Then link the real pipeline to it.
Two ways to work
KPD has two modes, and the switch at the far left of the toolbar moves between them:
| Mode | For | What you see |
|---|---|---|
| Storyboard | Business analysts, product owners, architects in a first workshop: anyone telling the story of where data comes from, what happens to it and where it goes. | Storyboards only. Seven simple items, plain questions, numbered steps and the story read back as sentences. No checks, no settings, no Terraform. |
| Engineer | The people who design the pipeline itself. | KPD as described in the rest of this guide: pipelines, every asset and property, validation, the design document and Terraform. Storyboards are there too, in the explorer. |
Switch with Storyboard | Engineer in the toolbar, View → Storyboard mode / Engineer mode, Ctrl/⌘+Shift+1 / 2, or the mode in the status bar. The mode is saved in the project, so it changes for everyone using it.
A new blank project starts in Storyboard mode. A Data Product (DPCF) project starts in Engineer mode, and so does any project made before Storyboard mode existed.
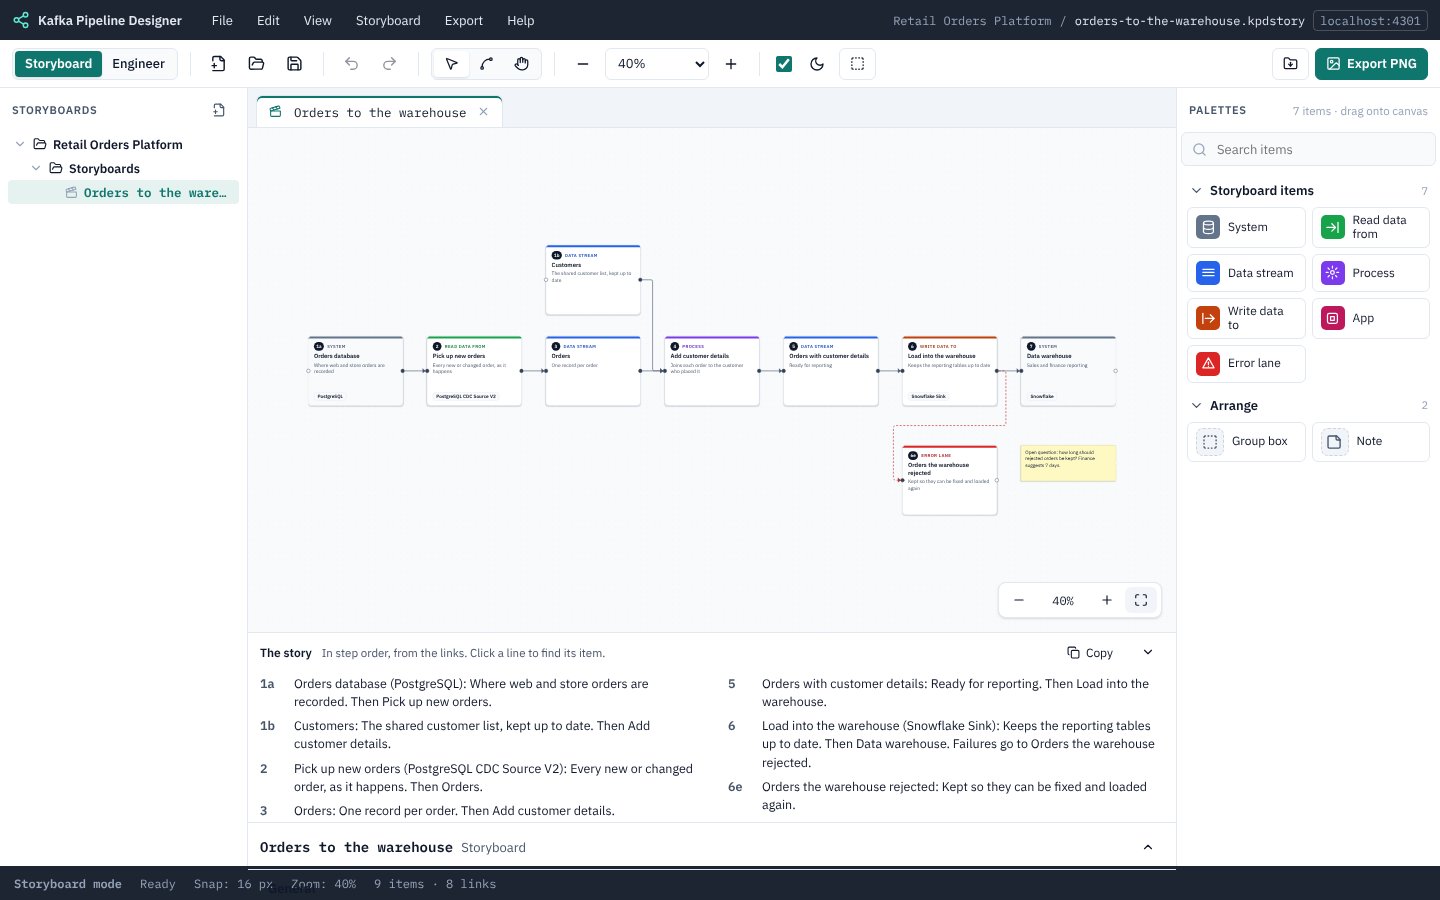
Making a storyboard
- Choose File → New storyboard… (or right-click Storyboards in the explorer) and give it a name.
- Drag items from the palette onto the canvas.
- Connect them in the order the data travels: drag from an item’s right-hand connector to the next item’s left-hand one. To say where failures go, drag from the red If it fails connector at the bottom of the item, usually down to an Error lane.
- Click an item and answer its questions in the panel underneath. Everything except the name is optional.
- Save with Ctrl/⌘+S.
With nothing selected, the panel describes the storyboard itself: its name, who owns it and what it is about.
The items
| Item | What it stands for | What it asks |
|---|---|---|
| System | A place data lives outside the pipeline: a database, an application, an API, a file store, a data portal. | The kind of system and its type (for example Database · PostgreSQL). The type suggests the systems KPD has connectors for, but you can type anything. |
| Read data from | Taking data out of a system. In the pipeline this becomes a source connector. | Which source connector you expect. See Connectors. |
| Data stream | Data moving between steps. In the pipeline this usually becomes a topic. | The key facts in each record (order id, customer id, total) and whether it carries personal data: yes, no or not sure. |
| Process | Something done to the data: joining, filtering, tidying, adding up. | What it does, in a few words. |
| Write data to | Putting data into a system. In the pipeline this becomes a sink connector. | Which sink connector you expect. |
| App | A team or application that uses the data directly. | What it does with it. |
| Error lane | Where failures go: records a step couldn’t handle, kept for someone to check. | What happens to them. |
Every item also has In a few words (the line shown on its card and in the story), More detail and Who owns it?. A new item is named after its kind until you rename it.
From Arrange in the palette, Group boxes and Notes work as they do on a pipeline. A note is a good place for an open question: the engineer sees it in the pipeline’s storyboard summary.
Telling the story
Step numbers
KPD numbers the items from the links, so the numbers always match the picture and you never renumber anything by hand:
- An item’s step is one more than the latest step that feeds it. Items with nothing feeding them are step 1.
- Items that share a step get letters, top to bottom on the canvas: 4a, 4b.
- An error lane takes the step it comes from, plus e: failures from step 6 go to 6e.
- Items that aren’t connected yet, and notes, have no number.
Moving items around never changes the numbers; changing the links does.
Flow or failure
The main flow leaves an item from its right-hand connector. Failures leave from the red If it fails connector at the bottom, as a dashed red line; an Error lane takes them in at its top, so a failure drops straight down from the step that failed. Read data from, Data stream, Process, Write data to and App can fail; a System and an Error lane can’t. Click a link to change what it shows: The data moves on or Where failures go. The link moves to the matching connector.
What can follow what
A storyboard follows the same shape as the pipeline it will become: a Data stream is where data waits between steps (a topic, to an engineer), and an Error lane is where failures wait (a dead letter topic).
| From | The main flow goes on to | If it fails |
|---|---|---|
| System | Read data from, App | – |
| Read data from | Data stream | Error lane |
| Data stream | Process, Write data to, App | Error lane |
| Process | Data stream | Error lane |
| Write data to | System | Error lane |
| App | Data stream, System | Error lane |
| Error lane | System, App, Data stream (whoever collects and fixes the failures) | – |
You don’t need to remember this. If you connect two items that need a step in between, KPD Studio adds it for you and selects it so you can name it: Read data from straight to a Process gains a Data stream; a System straight to a Process gains Read data from and a Data stream; a failure dragged to anything but an Error lane gains an Error lane. Quick add (the +) only offers what can follow.
The story
Under the canvas, The story reads the storyboard back as numbered sentences, built only from what you typed: “6 Load into the warehouse (Snowflake Sink): Keeps the reporting tables up to date. Then Data warehouse. Failures go to Orders the warehouse rejected.” Click a line to find its item. Copy puts the whole story on the clipboard for an email or a document. Hide it with the ⌄ button or View → Show the story.
Follow the story
To tell the story to a room, press Follow the story on the story strip (or View → Follow the story). KPD goes into workshop mode, hiding everything but the canvas, and walks through the story one numbered step at a time. The camera moves to each item, the picture builds up as you go (earlier steps stay lit, later ones are faded), and the step’s line is shown large, with its owner and anything still to decide, such as personal data marked not sure or a connector left to the engineer.
Use Next and Previous (→ ←), Play to run through it (Space pauses), or click any card to jump the story to it. Exit (Esc) stops; W leaves workshop mode. Items that aren’t connected yet aren’t visited. It is presentation only: nothing in the storyboard changes.
Connectors
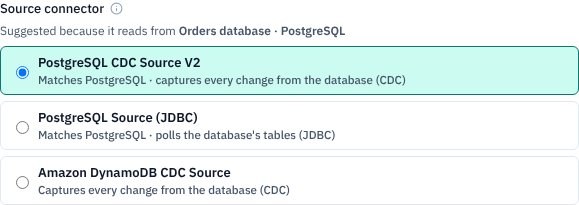
Read data from and Write data to suggest connectors from KPD’s catalogue, ranked for the System they are wired to. A Read data from fed by a PostgreSQL system puts PostgreSQL CDC Source first; a Write data to feeding Snowflake puts Snowflake Sink first. Each suggestion says why. Show all lists every source or sink connector.
If you don’t know, choose Not sure: let the engineer decide. It shows on the pipeline as an open question, so it isn’t forgotten.
Organising storyboards
Storyboards live in the project’s storyboards/ folder and can be kept in folders, for example one per team. Right-click Storyboards → New folder…, then drag storyboards onto a folder, or use Move to folder…. A folder’s right-click menu has New storyboard here…, New subfolder…, Rename… and Delete folder… (empty folders only). Rename, duplicate and delete a storyboard from its own right-click menu.
Sharing a storyboard
Export PNG saves the canvas as a picture, with step numbers and a legend. The story strip is not part of the picture; use Copy to take the story as text. Export project includes storyboards, like everything else in the project.
Storyboards and pipelines
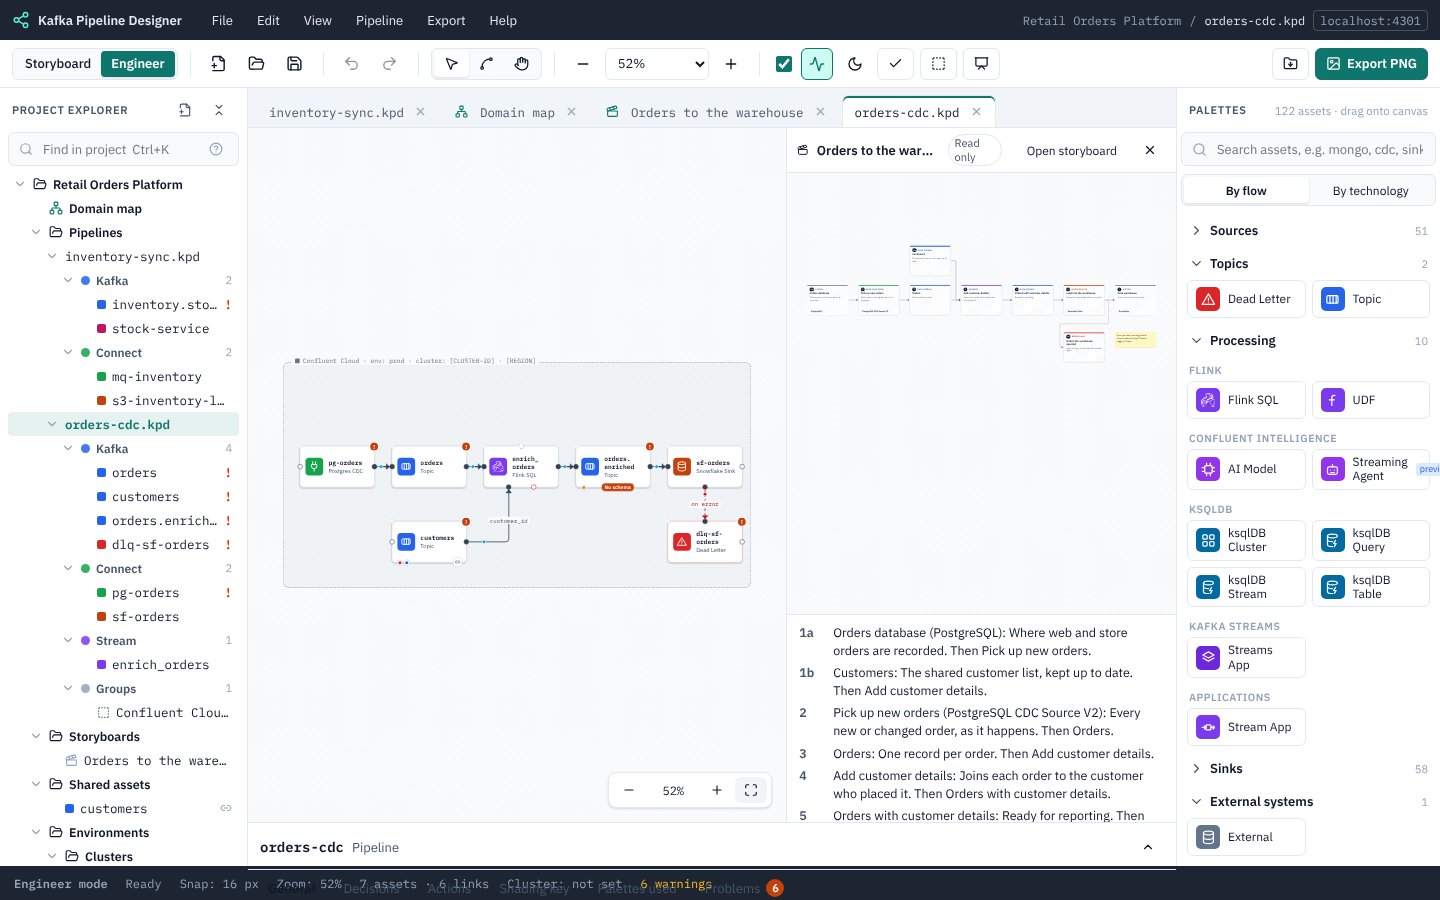
A storyboard and a pipeline are separate files, made by different people in either order. The only link between them is on the pipeline: in Engineer mode, click an empty part of a pipeline’s canvas and on its General tab choose the Storyboard it implements.
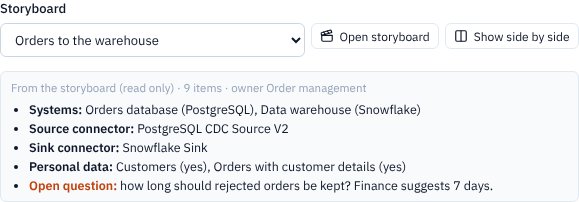
- The summary under the dropdown is read only: the systems and their types, the source and sink connectors, which data streams carry personal data, and the open questions (the storyboard’s notes, and every “Not sure”).
- Open storyboard opens it in its own tab.
- Show side by side (also View → Storyboard side by side) draws the storyboard, read only, next to the pipeline as you build it, with its story underneath. It pans and zooms on its own and is never part of the pipeline’s PNG.
- On the storyboard, Linked from lists the pipelines that point at it.
What Storyboard mode doesn’t do
- No checks: a storyboard is a sketch, so nothing is ever flagged as wrong.
- No Terraform, no design document, no technical export. Those come from the pipeline.
- Find in project and Validate look at pipelines only.
Try it
Both sample projects include a storyboard linked to a pipeline: Orders to the warehouse (Retail Orders, linked from orders-cdc) and Customer data products (Inclined Labs, linked from customer-data-products). Open either sample, switch to Storyboard mode, and click the storyboard in the explorer.