Working on the canvas
The canvas is where a pipeline is drawn: add assets, connect them, and arrange them so the design reads well.
The window
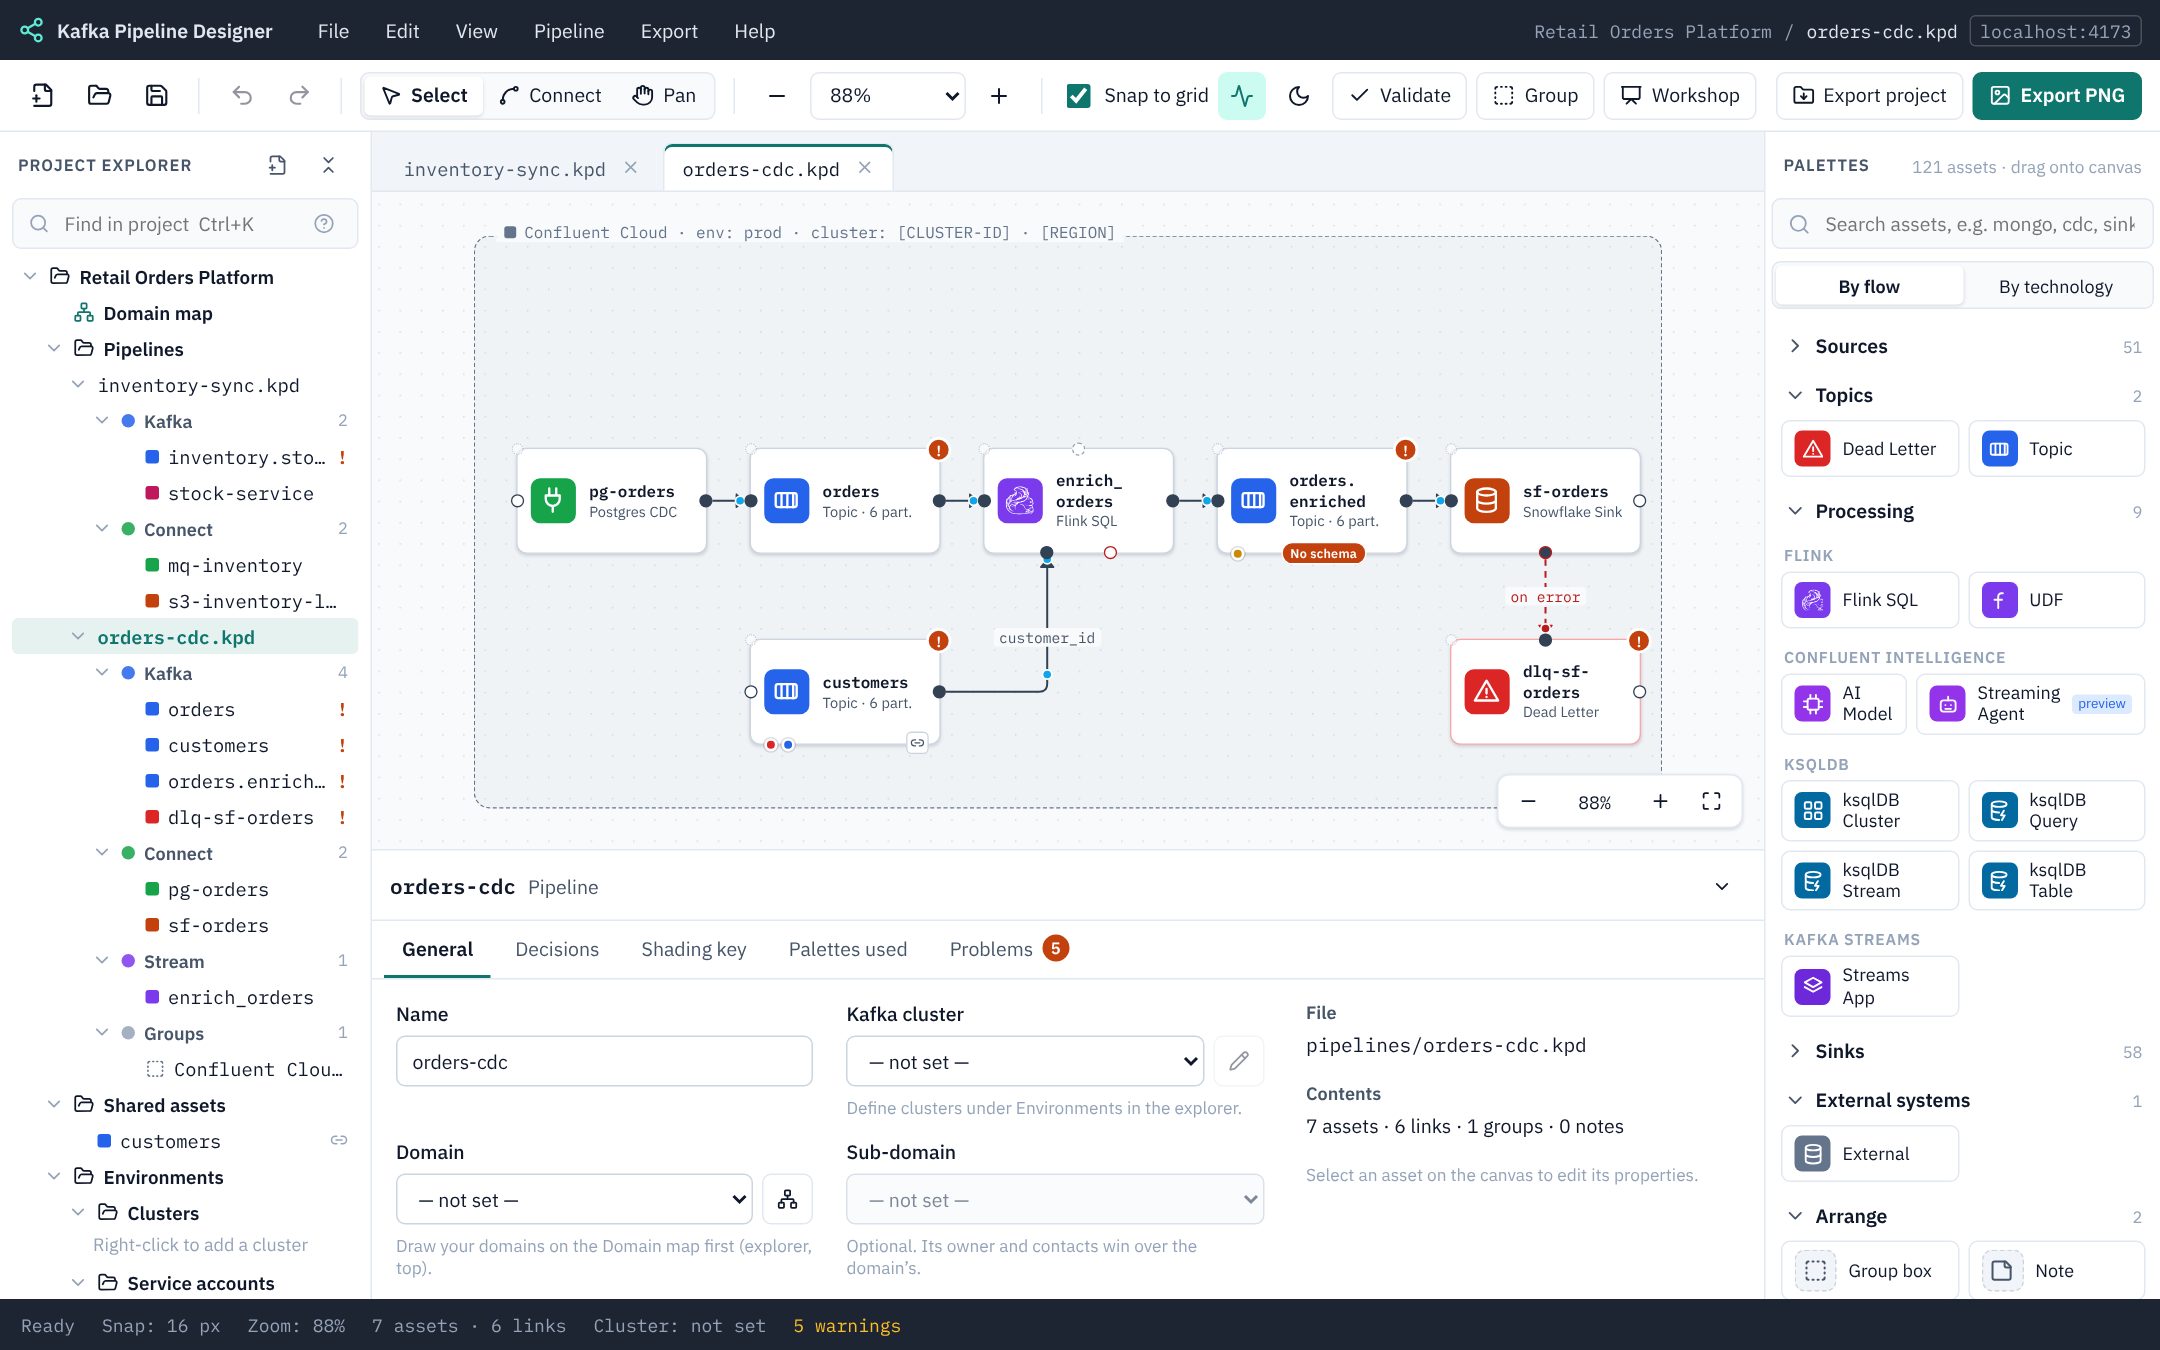
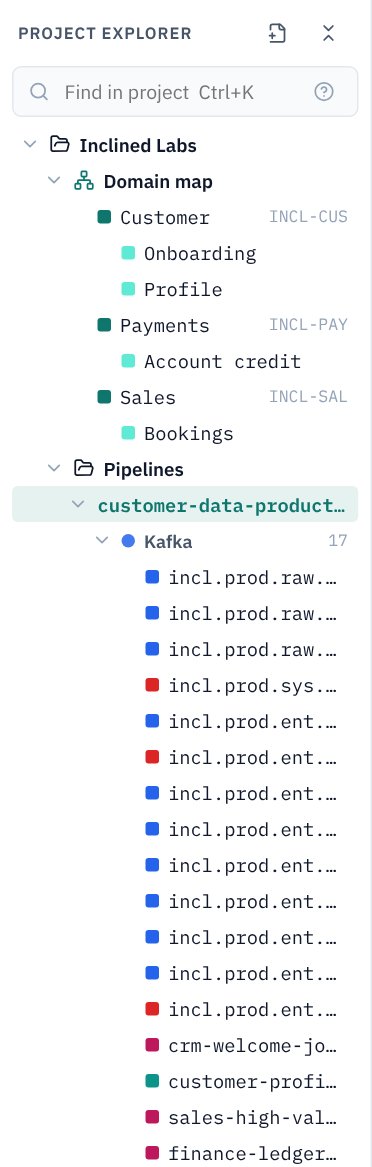
- Project explorer (left): the project's pipelines and the assets in each, shared assets, schemas, environments, stream configuration, governance, contract rules and exports. Under each open pipeline the assets are sorted into collapsible Kafka, Connect, Stream and External sections, then the pipeline's Groups, each with a count; a new asset appears in its section by itself. A collapsed section shows a ! when something inside has a problem, and selecting an asset on the canvas opens its section. The search box at the top is Find in project. Right-click any row for its actions. Drag the explorer's right edge to widen it; double-click the edge to reset.
- Canvas (centre): one tab per open pipeline. The pipeline's cluster name is shown faintly in the corner.
- Palettes (right): every asset type, by flow role (Sources, Topics, Processing, Sinks…) or by technology. Search with the box at the top. Drag its left edge to make it wider (it fits more assets a row) or narrower; double-click the edge to reset.
- Properties panel (bottom): the selected asset's tabs, or the pipeline's own tabs when nothing is selected. Drag its top edge to resize.
- Status bar: zoom, asset and link counts, the pipeline's cluster and the problem count.
Adding assets
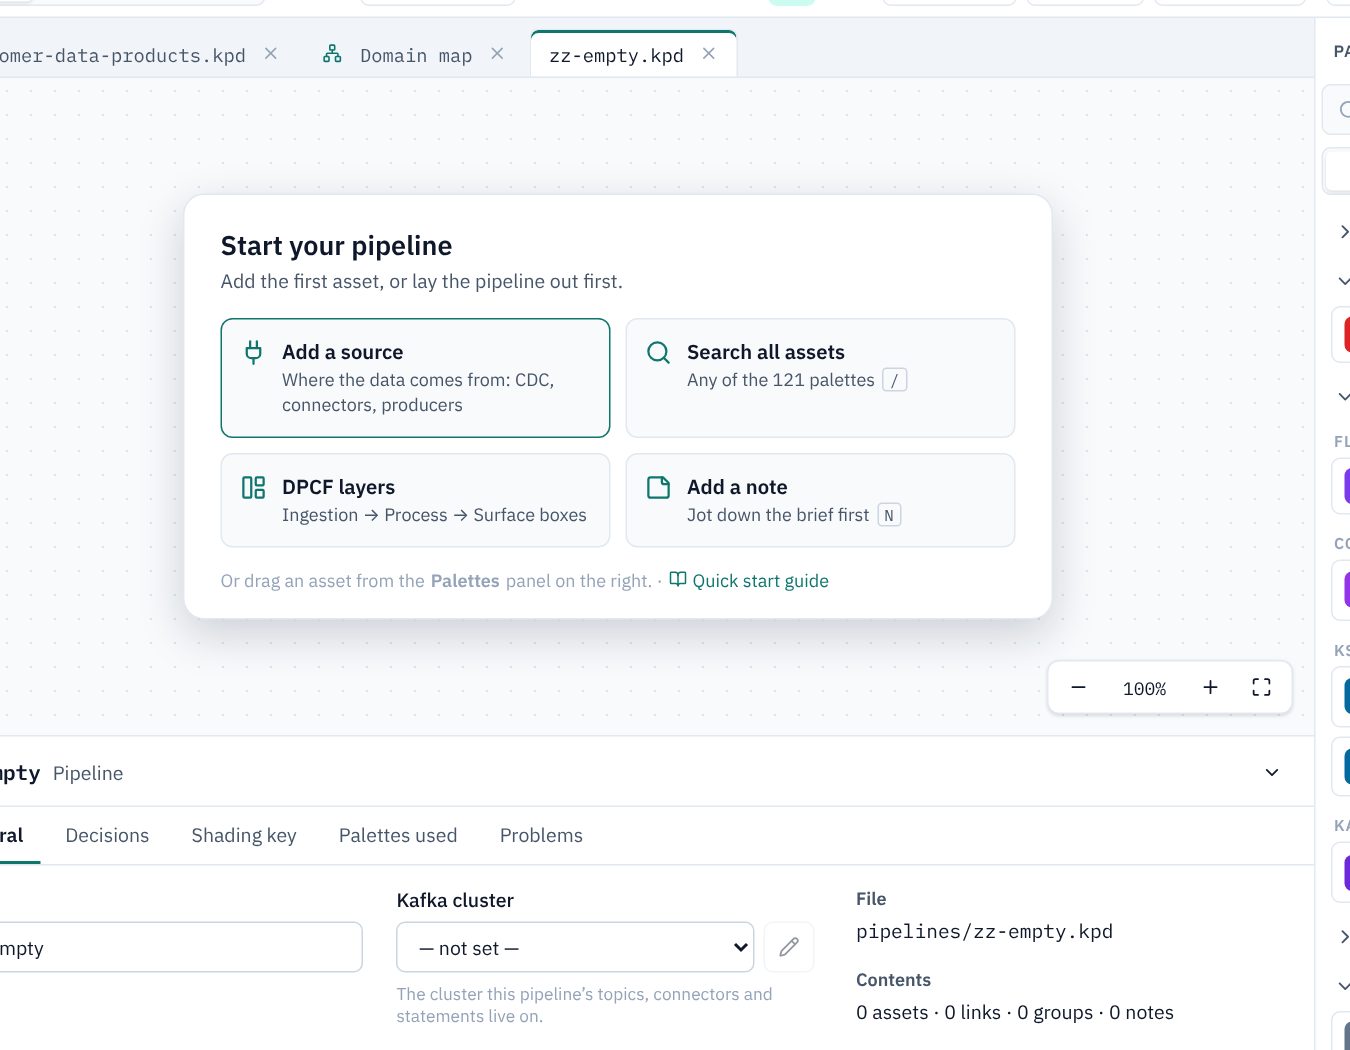
An empty pipeline shows a Start your pipeline card with the quickest ways in: Start from a system (draws an External system and selects it, so you can name the database, application or file store the data lives in), Add a source (quick add showing external systems and sources), Search all assets, DPCF layers (draws the Ingestion, Process and Surface boxes), and Add a note to jot down the brief. The card goes as soon as the first asset or note is added; over the DPCF layer boxes it shrinks to a slim bar so the boxes stay visible.
- Drag a palette from the Palettes panel onto the canvas.
- Or select an asset and use its + to add the next one already connected (quick add), or press / to search every asset.
- Copy, paste and duplicate with Ctrl/⌘+C, Ctrl/⌘+V and Ctrl/⌘+D.
Connecting
Drag from an output port (right or bottom edge of an asset) to an input port (left or top). KPD only accepts connections that make sense: a port that can't take the connection refuses it and a message says why. Drag the end of an existing connection to another port to re-wire it.
Connection styles tell you what flows: data flow solid with an arrow, join inputs into the bottom of a Flink statement, error routes dashed red into dead letter topics, and dashed lines for sharing (Tableflow, Stream Share) and links to external systems. Edge labels, such as on error or a join key, are set on the connection's properties.
Selecting, moving and zooming
| To | Do this |
|---|---|
| Select | Click an asset; drag a box on empty canvas; Ctrl/⌘+A selects all. |
| Pan | Scroll, or hold Space and drag, or use the Pan tool (H). |
| Zoom | Ctrl/⌘ + scroll, pinch, the zoom box in the toolbar, or Shift+1 to fit the pipeline. |
| Snap | The Snap to grid toolbar switch keeps assets aligned on a 16 px grid. |
| Delete | Delete or Backspace; undo with Ctrl/⌘+Z. |
Partition counts
To keep designs uncluttered, a topic on the canvas just says Topic. Tick View → Show partition counts to add each topic's partitions (Topic · 6 part.), on the canvas and in exported pictures. KPD remembers the choice. The count is always on the topic's Partitions & durability tab, and in the design document and Terraform, whichever way this is set. Some older screenshots in this guide show the counts.
Animated data flow
Dots travel along the connections that carry records: blue on data flow, red on error routes. They help when walking someone through a design. Toggle them with the pulse button on the toolbar or View → Animate data flow. They never appear in exported pictures, and they are off when your system asks for reduced motion. On a big pipeline they slow things down noticeably, so turn them off there (see How big can a design get?).
Dark mode
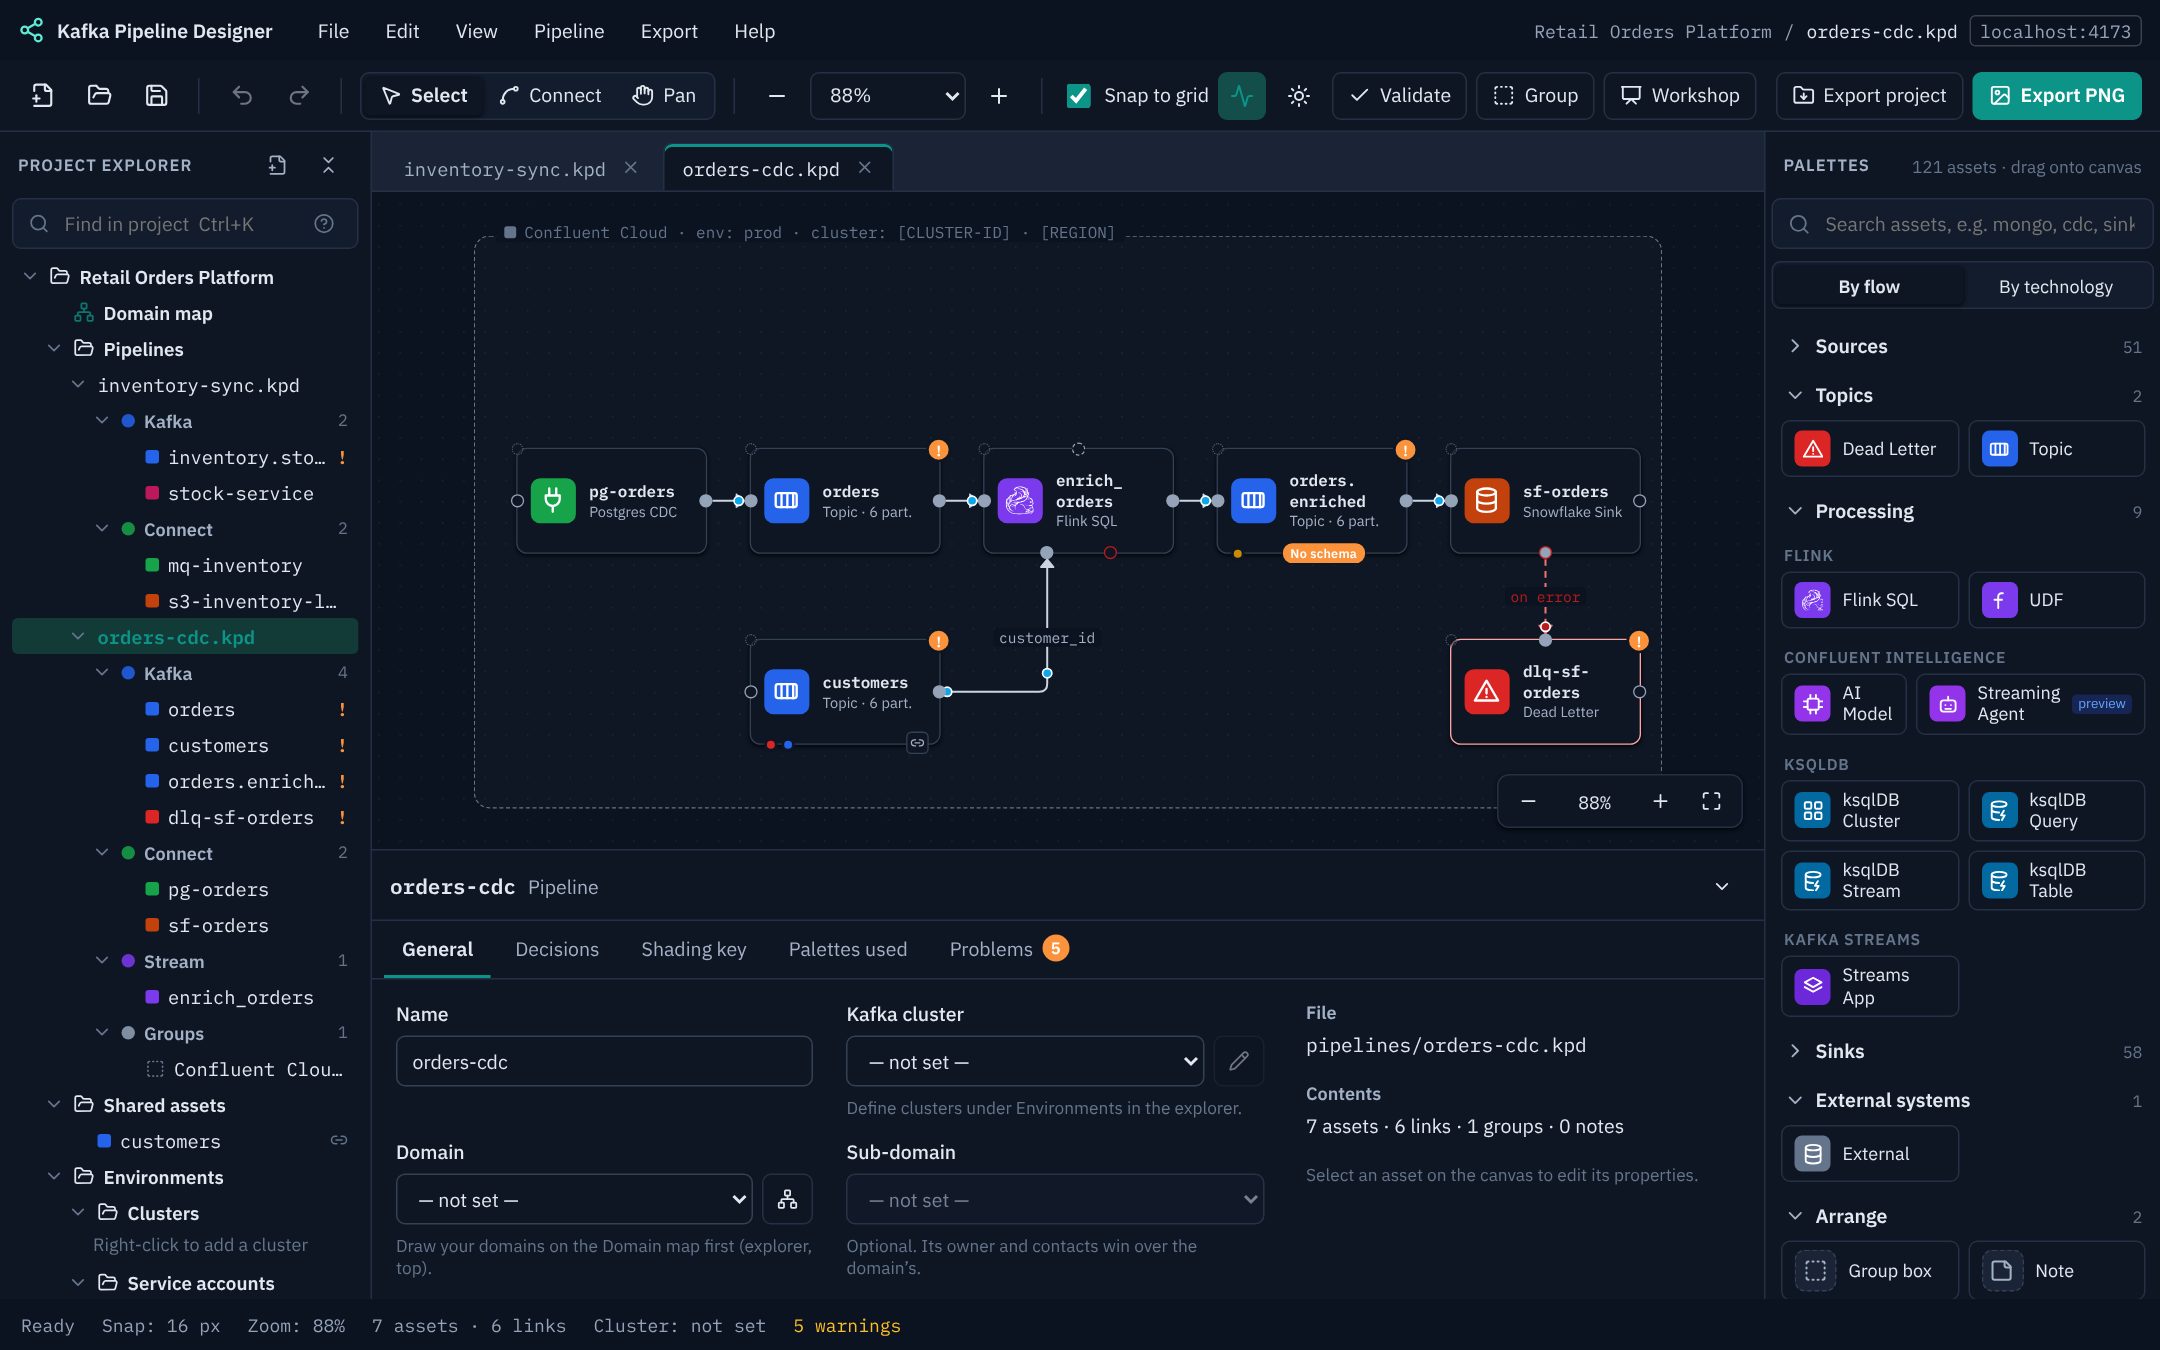
The sun / moon button on the toolbar switches between the light and dark themes; View → Theme… also offers Match system, which follows your computer's setting, and any seasonal looks the KPD team has turned on (see Themes and dark mode). The choice is remembered in this browser.
Linking to other pipelines (pipeline boxes)
When one pipeline feeds another, drag the other pipeline from the explorer onto this pipeline's canvas. It is drawn as a single pipeline box showing only where that pipeline starts and ends:
- Inputs (left): its entry topics, the ones nothing in that pipeline writes. Wire data into one, much like calling a sub-process.
- Outputs (right): its exit topics: data products, and topics nothing in it processes further. Wire from one to read it, or use the + beside it for what usually comes next.
- Nothing internal is shown, and dead letter topics are left out.
- Double-click the box (or its open button) to open that pipeline.
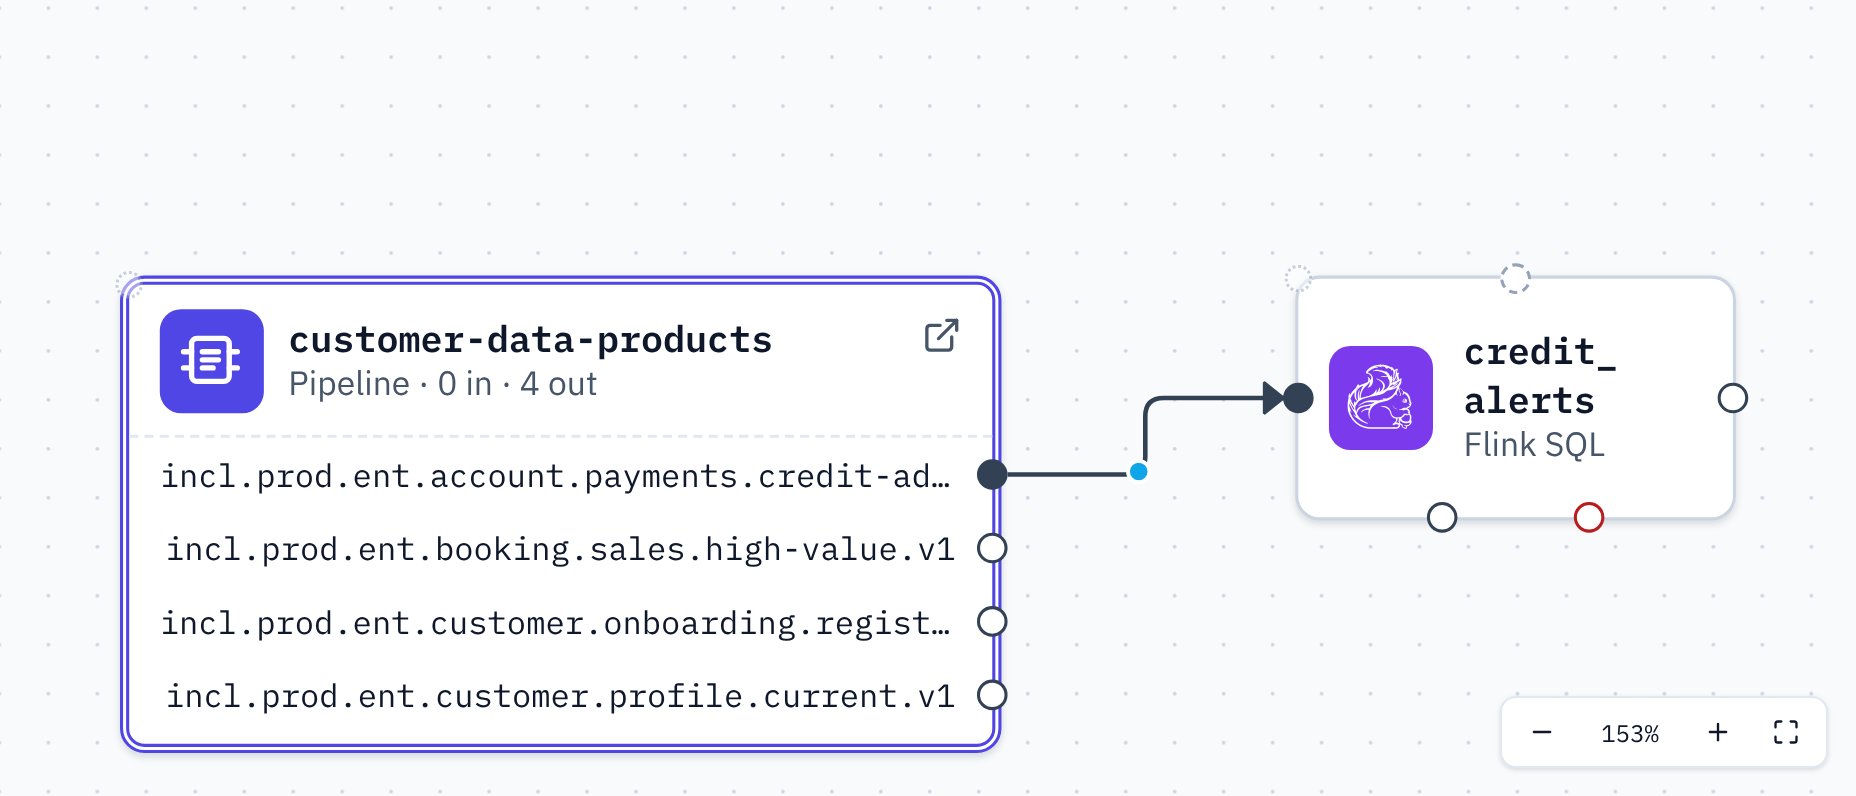
The connections are real: validation, read-access advice and the design document treat the box's port as the topic it stands for. Terraform never creates that topic a second time: it points to the pipeline that defines it, or looks it up as an existing topic.
Workshop mode
For designing in front of a client, press W (or Workshop on the toolbar, or View → Workshop mode). The menus, toolbar, explorer, palettes, tabs and status bar disappear, leaving the canvas and the properties panel, with a small bar floating over the top of the canvas.
- Adding assets: press / (or Add on the bar) and type what you want, or select an asset and use the + beside one of its outputs for what usually comes next. Everything else works as usual: drag to connect, G for a group box, N for a note, D / A for a decision or assumption.
- Problem badges are hidden, so a design in progress doesn’t show red counts to the room. The warning button on the bar shows them again.
- The bar also has undo and redo, zoom and fit, the theme, and full screen (the browser’s own; Esc leaves it too).
- W or Exit brings the full window back. Workshop mode isn’t remembered: KPD always opens in the normal view.
Workshop mode works on storyboards too, where the bar offers Follow the story instead of Follow the data.
Follow the data
Follow the data on the workshop bar walks a single record through the pipeline, one asset at a time, so the design explains itself to the room. The camera moves to each hop, the rest of the canvas fades, and a caption — generated from the design, the same wording as the detailed design document — says what happens there: "incl-bookingdb-cdc captures changes from InclinedBooking DB and writes…", "customer_raw_to_cdm transforms the data…", "crm-welcome-journey consumes it and delivers to the Marketing CRM."
- Play / Pause runs the walk on its own or holds it; ← / → (or the arrows on the card) step back and forward; Esc or Exit ends it. Keys work without reaching for the mouse, for presenting.
- If the pipeline reaches more than one destination, a journey picker lets you choose which path to follow — one per end-to-end route from the source to a data product, sink or external system.
- Forks are shown as the record passes: a Flink step that sends failures to a dead letter topic, or one enriched by a join from another stream, lights that branch up and tags it, without cluttering the main line.
Auto-place
Pipelines created outside the canvas (for example by a script) may have assets without positions. Pipeline → Auto-place unpositioned nodes lays them out in flow order.
Saving
Pipelines are saved with Ctrl/⌘+S (or Ctrl/⌘+Shift+S for all open pipelines); a dot on the tab shows unsaved changes. Project-wide definitions such as clusters, service accounts, tags and rules are saved to the project file immediately when you change them.
Auto save. Tick File → Auto save (every 5 minutes) and KPD saves every open pipeline with unsaved changes every five minutes, counting from when you switch it on. It saves quietly: no toast, and no "Save with errors?" question, because a design in progress may be saved with errors. Pipelines opened read-only are never auto-saved. The status bar shows Auto save on and when it last saved. Your browser remembers the choice, so it stays on next time; untick it to go back to saving only when you ask. Undo still works after an auto save.